Category: Economy News
Photo by Richard Hurd
Metro Metrics March 2026

Metro Metrics is a monthly data snapshot that explores key economic indicators reflecting the health of the Madison metro economy.
Q4 Economic Update
This month’s edition of Metro Metrics examines key performance indicators in Greater Madison’s economy and how they changed throughout 2025.
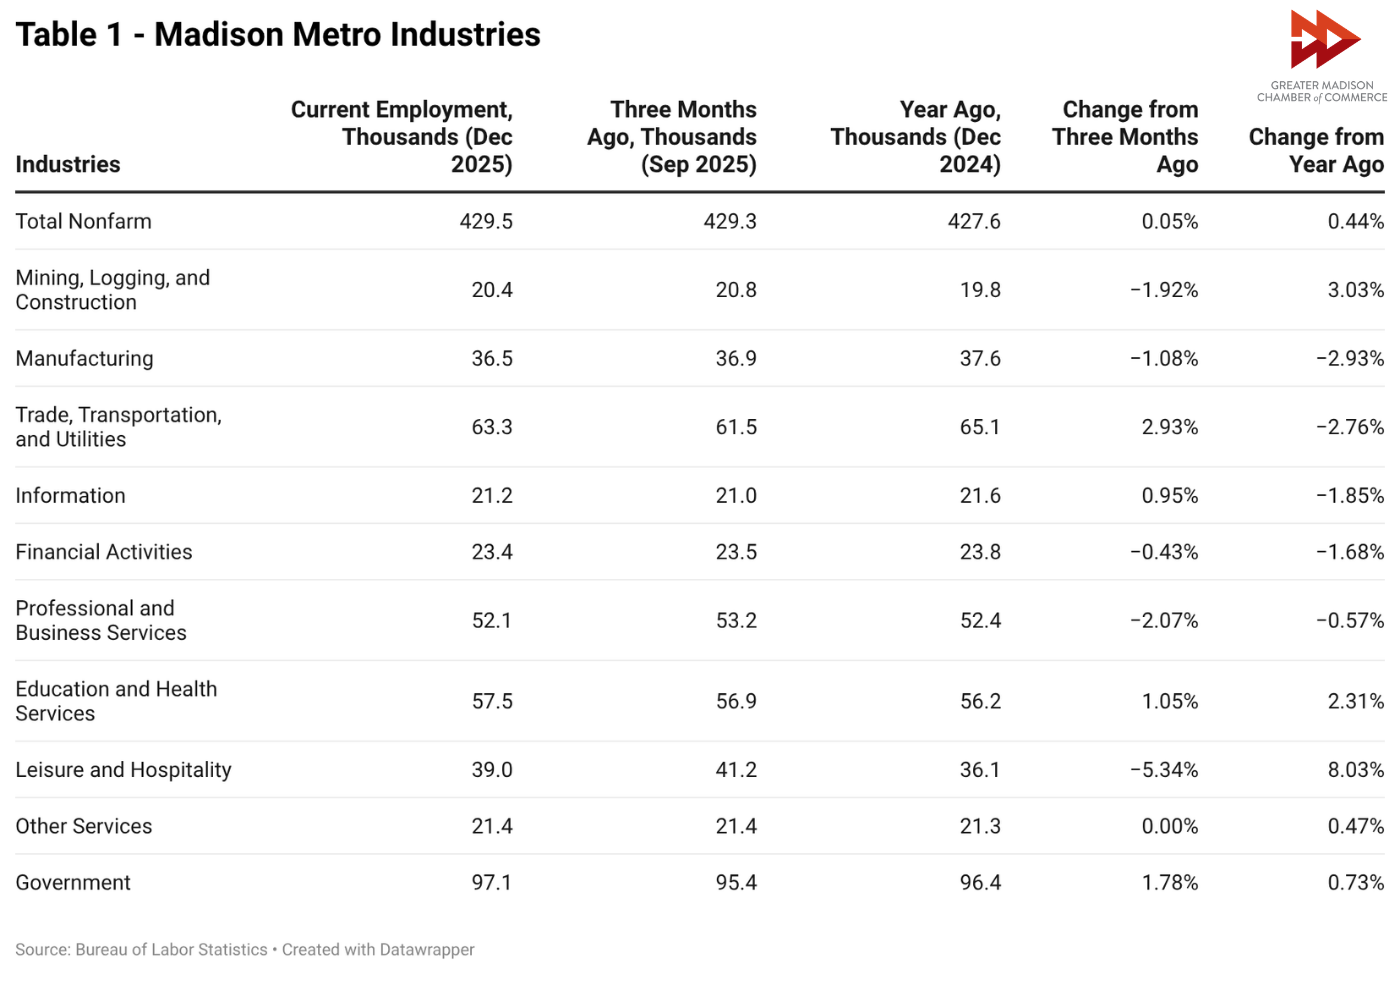
Industries (Table 1)
Overall employment in the Greater Madison region remained relatively steady, with job growth of 0.44% over the year. This is stronger than the job growth seen in 2024 of only 0.02%, but less than the rate of growth in 2021, 2022 and 2023, which saw over 2% growth. These numbers reflect statewide and nationwide patterns of reduced job growth in 2024 and 2025.
The region’s job growth was driven in large part by gains in education and health services, again reflective of state and national trends. As the nation’s workforce ages, the health services sector has seen large job growth due to increased demand for eldercare.
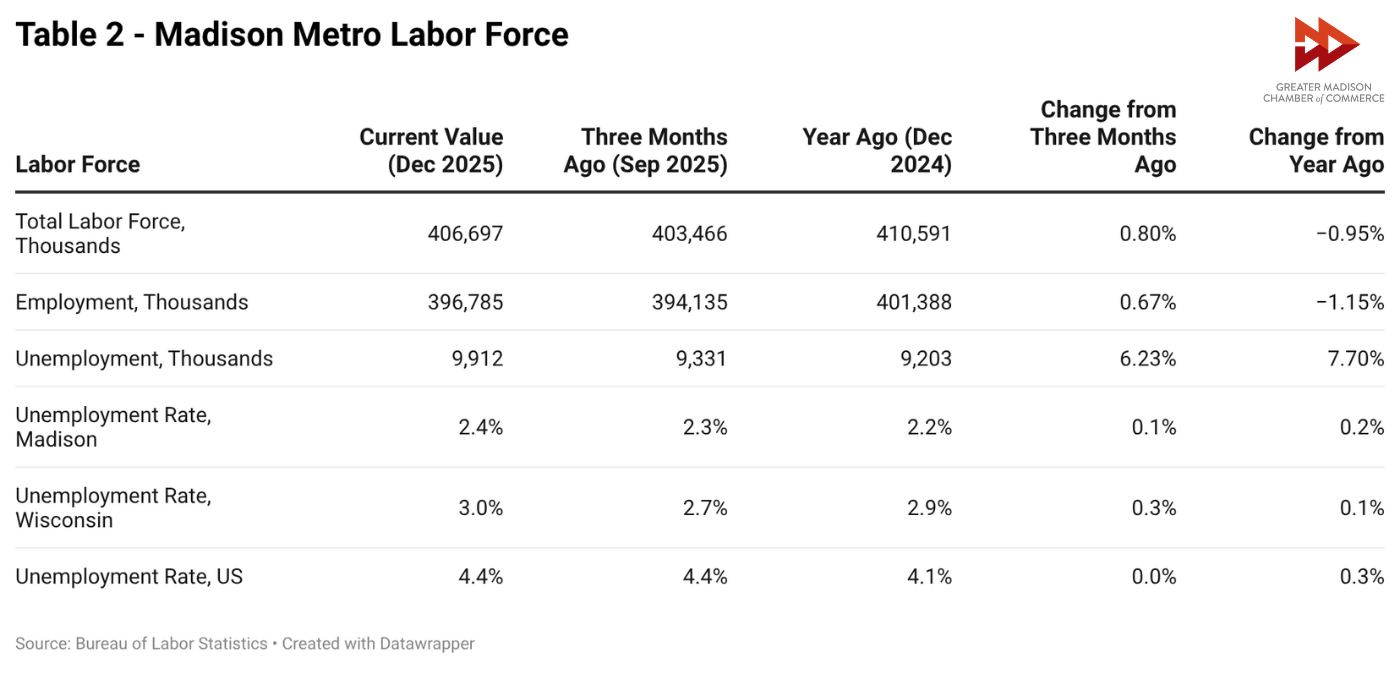
Labor Force (Table 2)
The region’s workforce saw a modest retraction in line with the slowdown in demand for jobs. As with the jobs report, this is reflective of larger statewide and nationwide trends and is not unique to Greater Madison. The number of employed people in the region declined by about 1% in 2025, as did the total labor force. This resulted in a roughly constant unemployment rate over the year, ending at 2.4% in December, the 13th lowest among the 387 metropolitan areas in the nation.
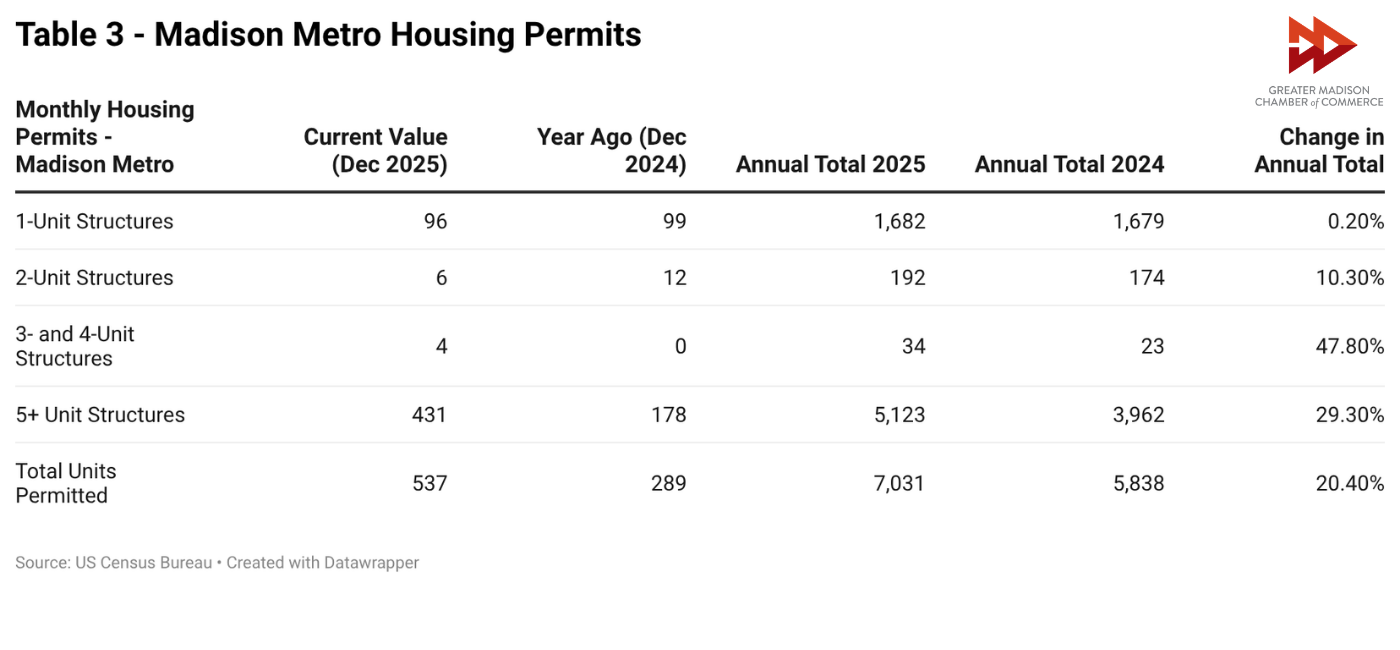
Housing Building Permits (Table 3)
Housing permits in the region rose by more than 20% over the year. This growth was primarily driven by a nearly 30% increase in permits granted for structures containing five or more housing units. With more than 7,000 housing units granted construction permits in 2025, the region’s housing supply should see a sizable boost in the coming years as these structures move through the construction process.
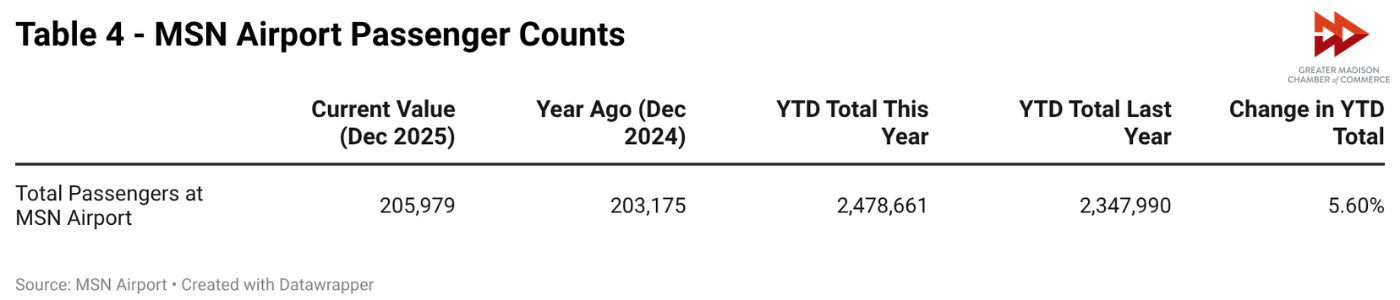
MSN Airport Update (Table 4)
Dane County Regional Airport had a record-breaking year in 2025, seeing the most passengers in its history and surpassing its previous pre-pandemic high of 2.38 million. The airport served 5.6% more passengers than in 2024, and announced new nonstop service to Boston and the Research Triangle.
Source: Dane County Regional Airport
Photo by Richard Hurd
Chamber statement on Exact Sciences economic impact report
FOR IMMEDIATE RELEASE (March 19, 2026)
Contact: Communications Manager Jess Miller, jess@madisonbiz.com, (608) 443-1952
MADISON, WI — Today, the Center for Research on the Wisconsin Economy (CROWE) issued a report on the economic impact of Exact Sciences. In response to this announcement, Greater Madison Chamber of Commerce President Zach Brandon released the following statement:
“With annual GDP contributions of $6-7 billion — almost 2% of the entire state’s economy — few organizations in Greater Madison’s history have had as significant an impact as Exact Sciences.
“This report also underscores the foundational role Exact Sciences has played in establishing Greater Madison’s reputation as a global leader in healthcare, life sciences and research innovation. Since moving its headquarters from Boston to Madison in 2009, the company has generated a total local employment impact of more than 20,000 jobs both directly and through multiplier effects.
“We are confident that with Abbott’s support, reach and resources, Exact Sciences will continue to attract top talent from across the globe, find innovative solutions to some of healthcare’s most complex challenges and play a pivotal role in our region’s thriving economy.”
###
About the Greater Madison Chamber of Commerce: The Greater Madison Chamber of Commerce is the voice of business with more than 1,200 organizations – ranging from one-person shops to corporations with more than 10,000 employees – working to bring the Greater Madison area to its full potential. The Greater Madison region is a leader in innovation. From cutting-edge technologies to distinctive retail shops to inventive services and products, our members vary greatly but are united by the region’s entrepreneurial spirit. More information can be found at madisonbiz.com.
Photo by Richard Hurd
Metro Metrics February 2026
Metro Metrics is a monthly data snapshot that explores key economic indicators reflecting the health of the Madison metro economy.
American Community Survey Update
Last month, the U.S. Census Bureau released the 2024 edition of its five-year American Community Survey (ACS), with data covering the years 2020-2024. The survey is conducted every year with five-year results calculated over the course of five samples, making them more robust and reliable. This month’s edition of Metro Metrics examines key measures of the Madison Metro population as well as how they have changed over time.
A Younger Population
Over the past 15 years, the median age in the U.S. has increased from 36.9 to 38.9 years, while the median age in Wisconsin has increased from 38.1 to 40.2 years (Fig. 1). A greater proportion of people, especially in the Midwest, are over 65 years old and are leaving the workforce. While Greater Madison is facing the same challenges as Wisconsin and the U.S., the region is younger and less impacted by them.
One way economists understand how an aging population impacts the economy is through a measure called the old-age dependency ratio (Fig. 2). This ratio represents the number of people in a population aged 65 years old and older divided by the working age population (15-64 years old). Wisconsin’s current old-age dependency ratio is 30.8%, meaning that for every one person at retirement age, there are about three people of working age. The Madison Metro’s ratio is 24.8%, meaning that for every one person of retirement age, there are about four people of working age.
Every measure of workforce age in the ACS shows that Greater Madison is younger than Wisconsin and the U.S., illustrating the region’s competitive positioning against aging workforce trends affecting the nation.
Labor Force Participation
One consequence of an aging labor force is a decrease in the proportion of the population that is employed or looking for work, known as Labor Force Participation (Fig. 3). This rate tends to peak among people aged 25 to 54 and decrease outside that range. If a population has a lower share of people in these prime working years and a larger share of people outside of them, its labor force participation rate tends to decline. Labor force participation rates in Wisconsin have typically been above those of the nation’s, with the Madison Metro being above that mark. This trend has not changed in the 2024 ACS but the differences in rates have narrowed since 2010.
University-Educated Workforce
The 2024 ACS five-year estimates showed for the first time that a majority of people (50.1%) living in the Madison Metro aged 25 years old or older have a bachelor’s degree or higher (Fig. 4). This gives our metro the 28th highest proportion of university-educated adults out of the 935 total areas measured in the country, putting the region in the top 3%. This proportion of bachelor’s degree holders soars above Wisconsin’s (33.4%) and the country (35.7%) and is in the same league as leading high-tech regional economies such as San Francisco, Boston, Seattle and the Research Triangle.
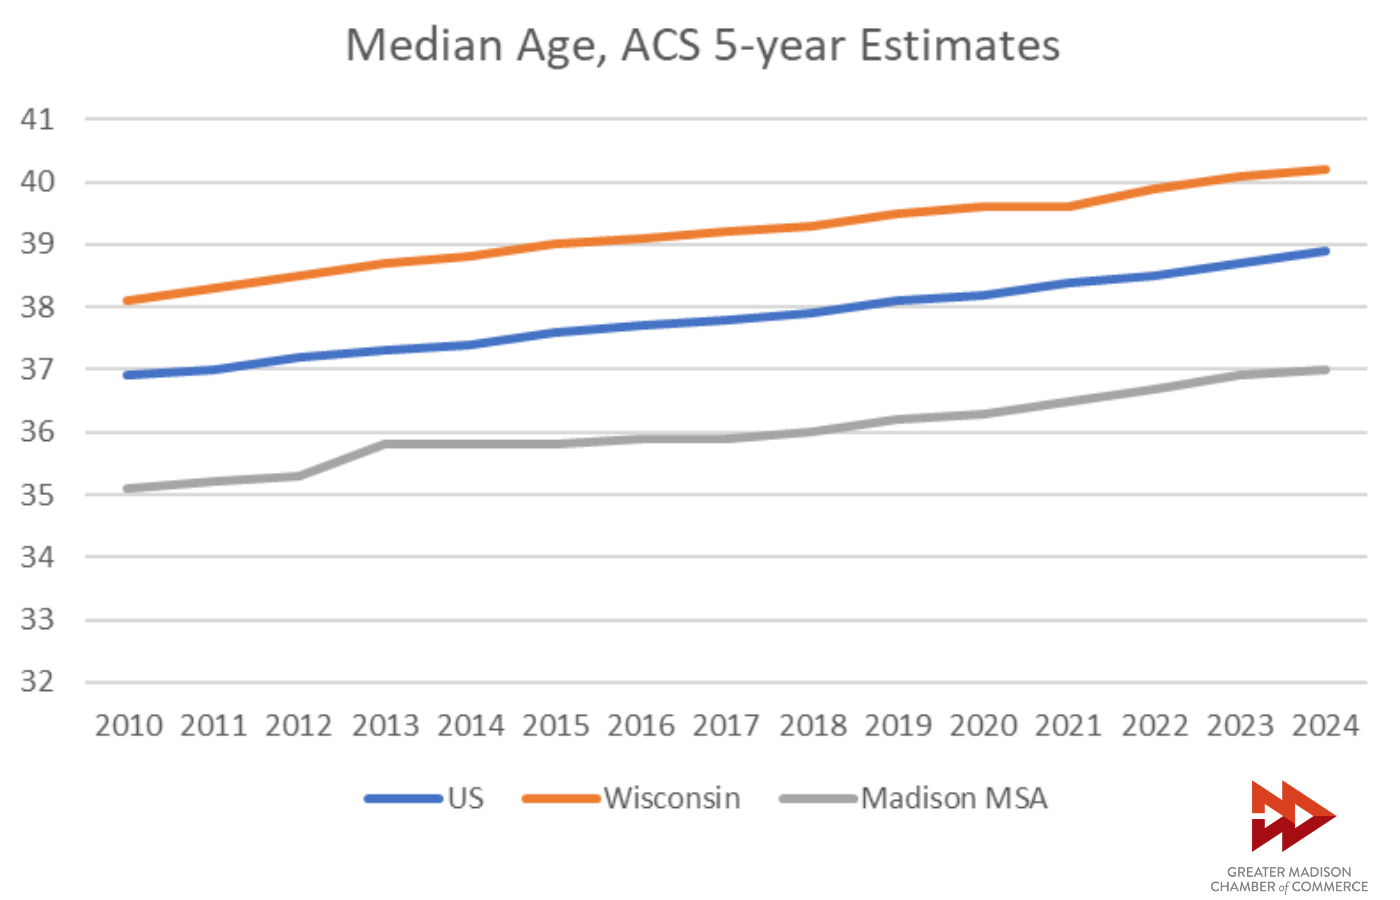
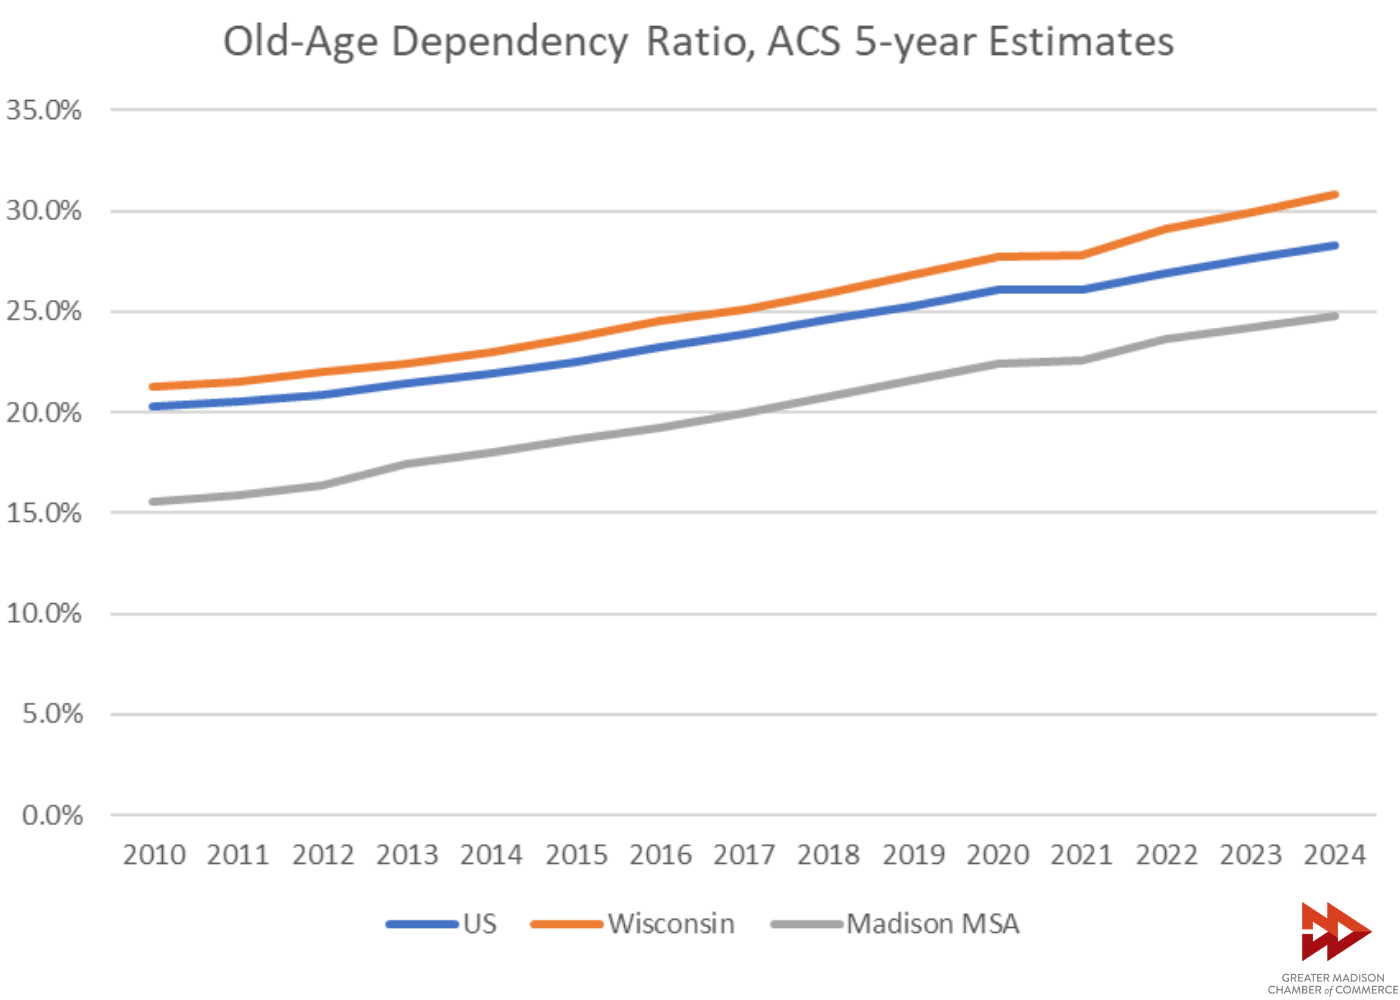
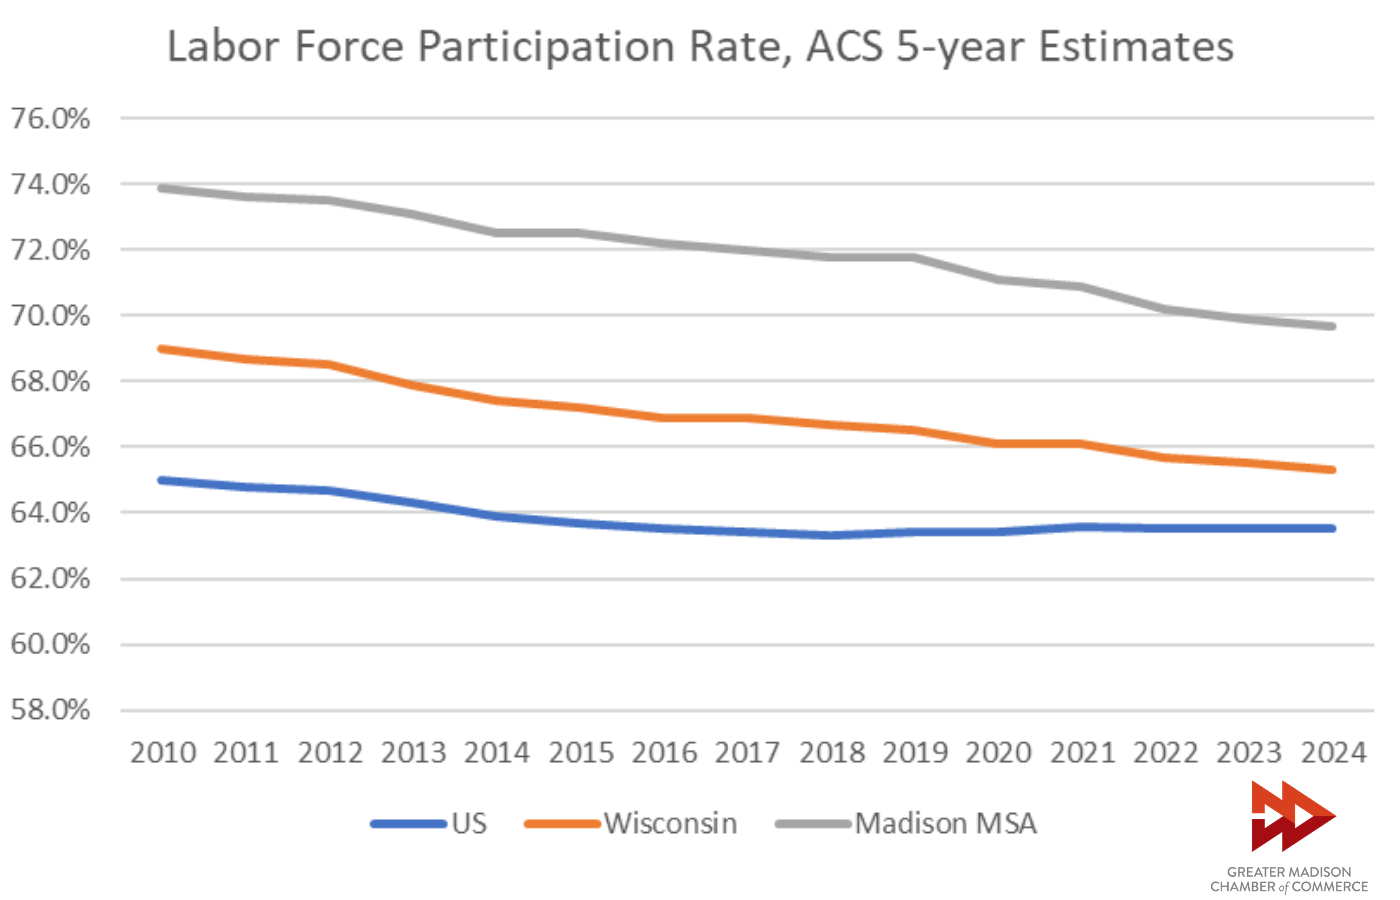
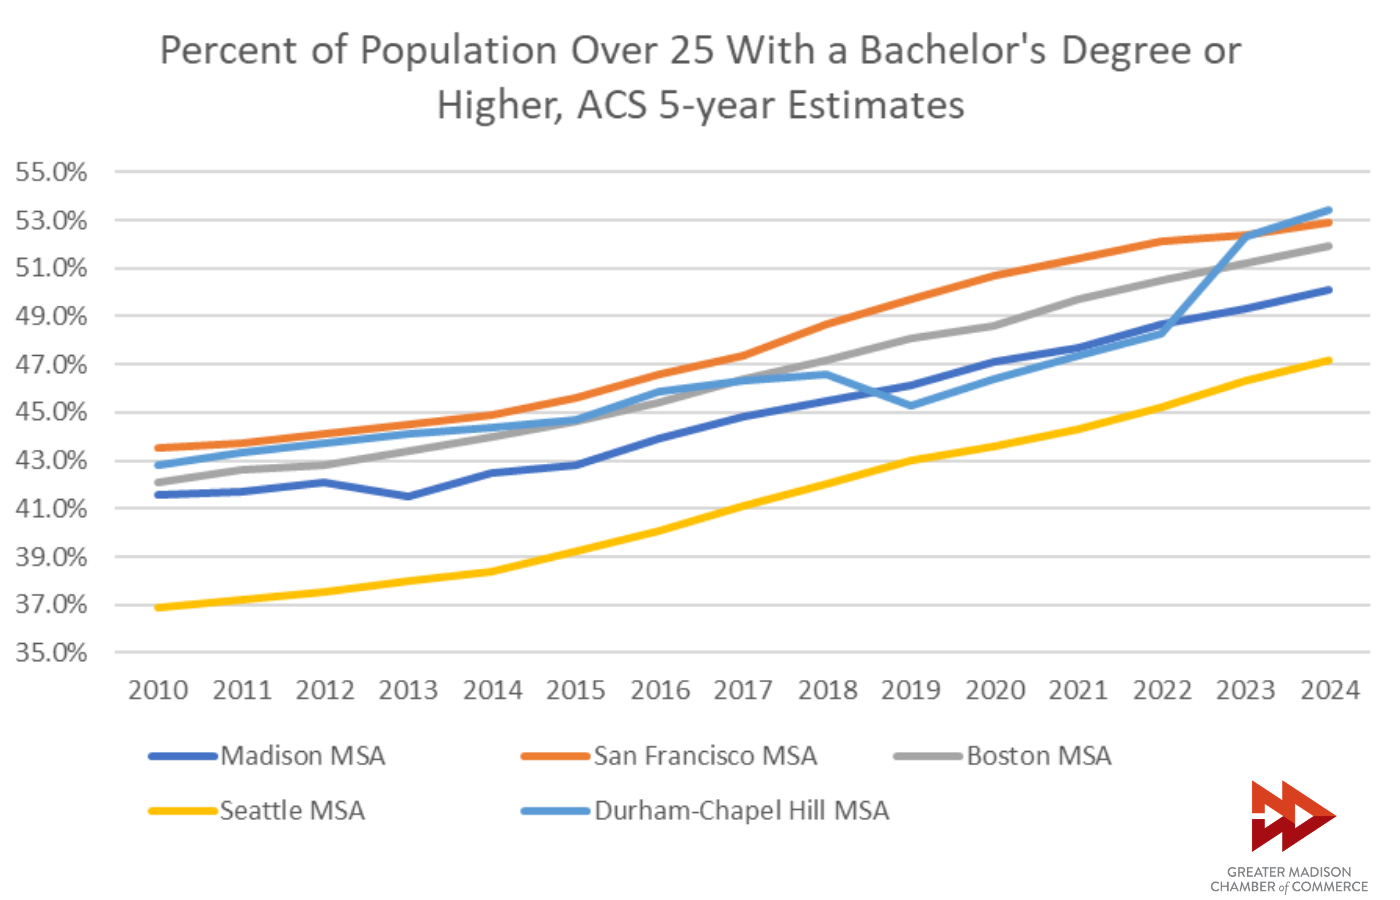
Photo by Richard Hurd
Metro Metrics January 2026
Metro Metrics is a monthly data snapshot that explores key economic indicators reflecting the health of the Madison metro economy.
Tracking Regional Workforce Housing
Available housing supply has been a challenge in the Madison region for years. A 2019 report by the Wisconsin REALTORS® Association found that Dane County underproduced more than 11,000 housing units from 2006 to 2017. And the Dane County Regional Housing Strategy concluded that the county needs to produce at least 7,000 new housing units per year for supply to keep up with demand.
This month’s edition of Metro Metrics takes a look at recent data to assess our collective progress on this issue.
Madison’s Apartment Market
One source the Chamber uses for housing data is CoStar. This database of commercial properties helps us analyze trends in apartment rental markets across the country.
In 2025, the Madison Metro added a net 2,802 multi-family housing units, an increase of 2.8%. Effects of this added supply include a modest increase to the region’s vacancy rate from 5.9% to 6.2% and a reduction to the region’s year-over-year asking rent price growth from 2.5% to 1.4% (Fig. 1).
A clear correlation can be seen between vacancy rate and rent growth. When vacancy rates dip below 4%, as they did in 2020 and 2021, rent increases typically follow. Now that vacancy rates in the region have begun increasing again, rent growth has dropped down to its typical 1-2%-per-year rate.
CoStar reports there are 5,837 multifamily housing units currently under construction in the region (Fig. 2). This figure is higher than at any point before the pandemic but remains below the peaks recorded in 2021 and 2022. Overall, there is a strong upward trend in number of units under construction.
Single-Family Home Sales
The Wisconsin REALTORS® Association recently released their December 2025 report, which included data on single-family home sales in all Wisconsin counties. According to the report, the Madison Metro market grew over the past year. Columbia, Dane and Green counties saw increases in sales. Iowa County was the only county in the metro to experience a decline.
Benchmarking Progress
The City of Madison has a housing tracker on its website with valuable information about the quantity and type of housing that is being built within the city. Madison leaders set a goal to build 15,000 new housing units by 2030, an average of 3,000 units per year. Last year the city added a net 2,328 housing units, slightly less than the target number. Currently, 5,320 units are under construction.
An additional data point is the Dane County Regional Housing Strategy 2024 Annual Metrics Report. This report is based on a survey of Dane County municipalities regarding their activities in the 2024 calendar year. The report found that seven of 12 municipalities had affordable housing funds, which the strategy defined as a key need in the region’s housing market. The report also found that 700 affordable housing units were funded in Dane County in 2024 (out of the 1,765 the report set as an annual target) and that 172 affordable senior housing units were funded (out of the 700 the report set as an annual target).
The strategy includes a target number of 7,000 total housing units per year in Dane County. In 2024, 5,477 housing units were permitted county-wide. Though an increase from 2023, the number of housing units permitted still misses the strategy’s goal. The report “illustrates both early momentum and the scale of work still required,” a statement which applies not just to Dane County’s housing market but also the entire region.
Fig. 1
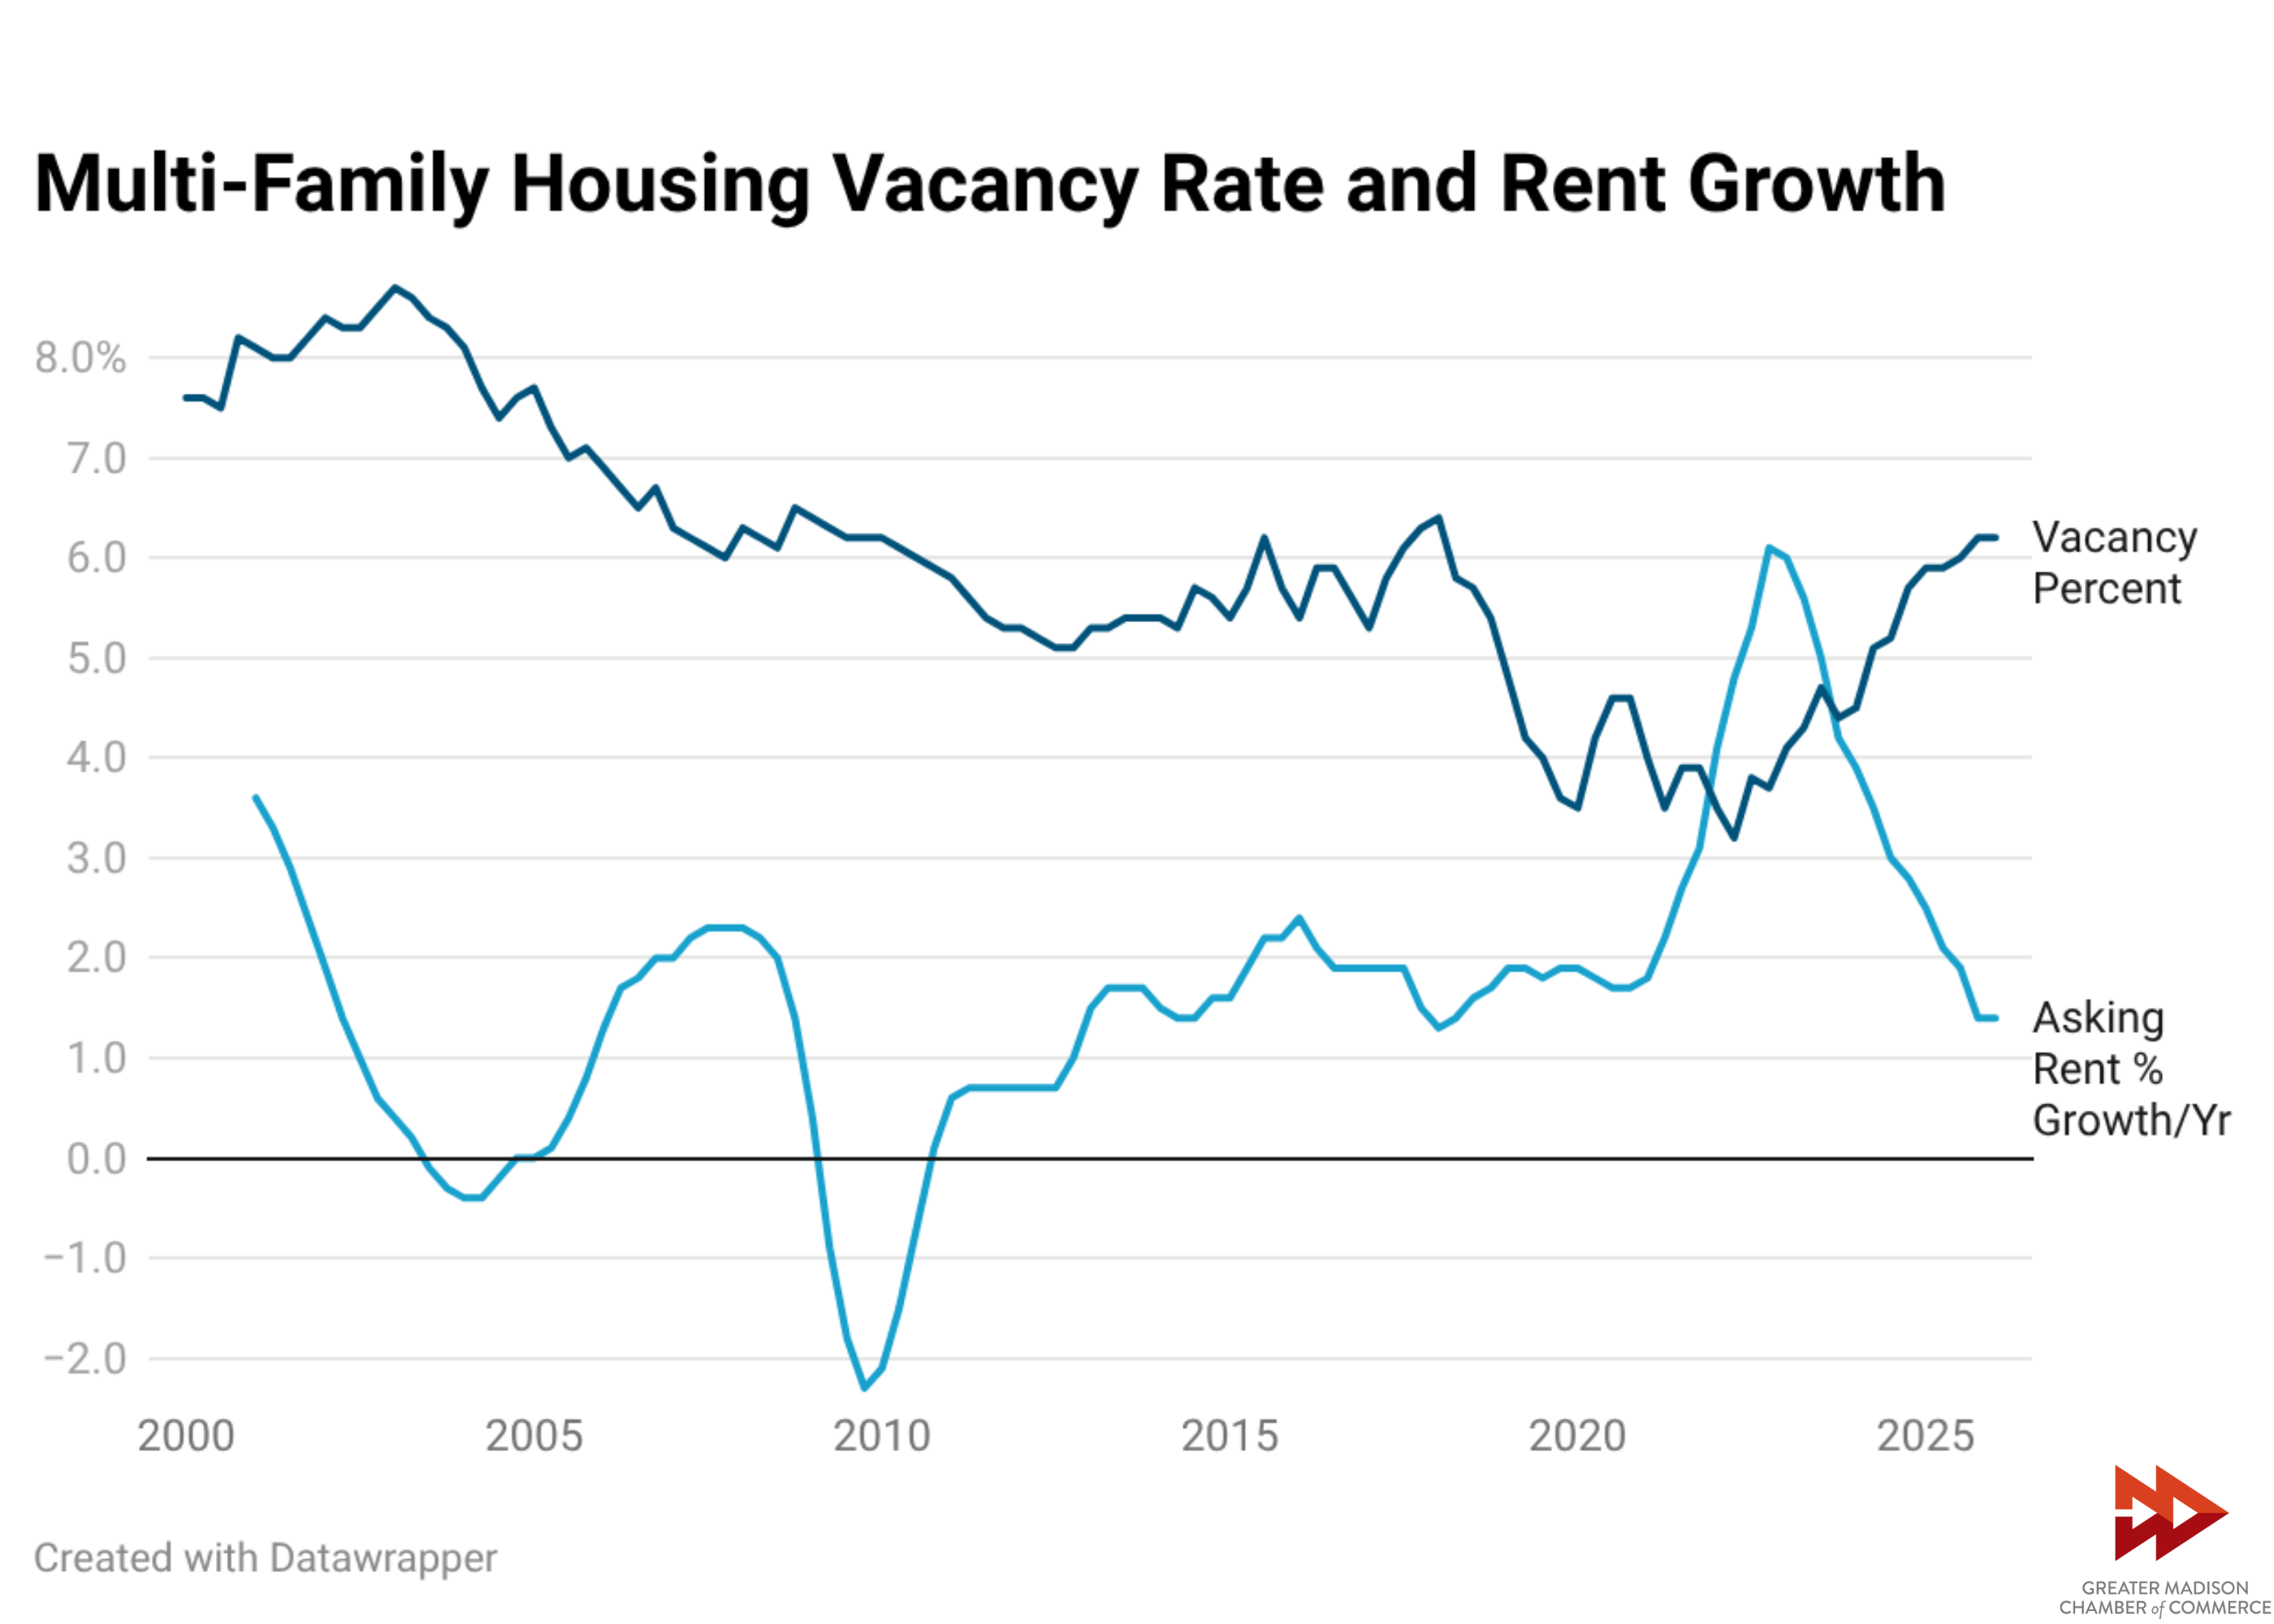
Fig. 2
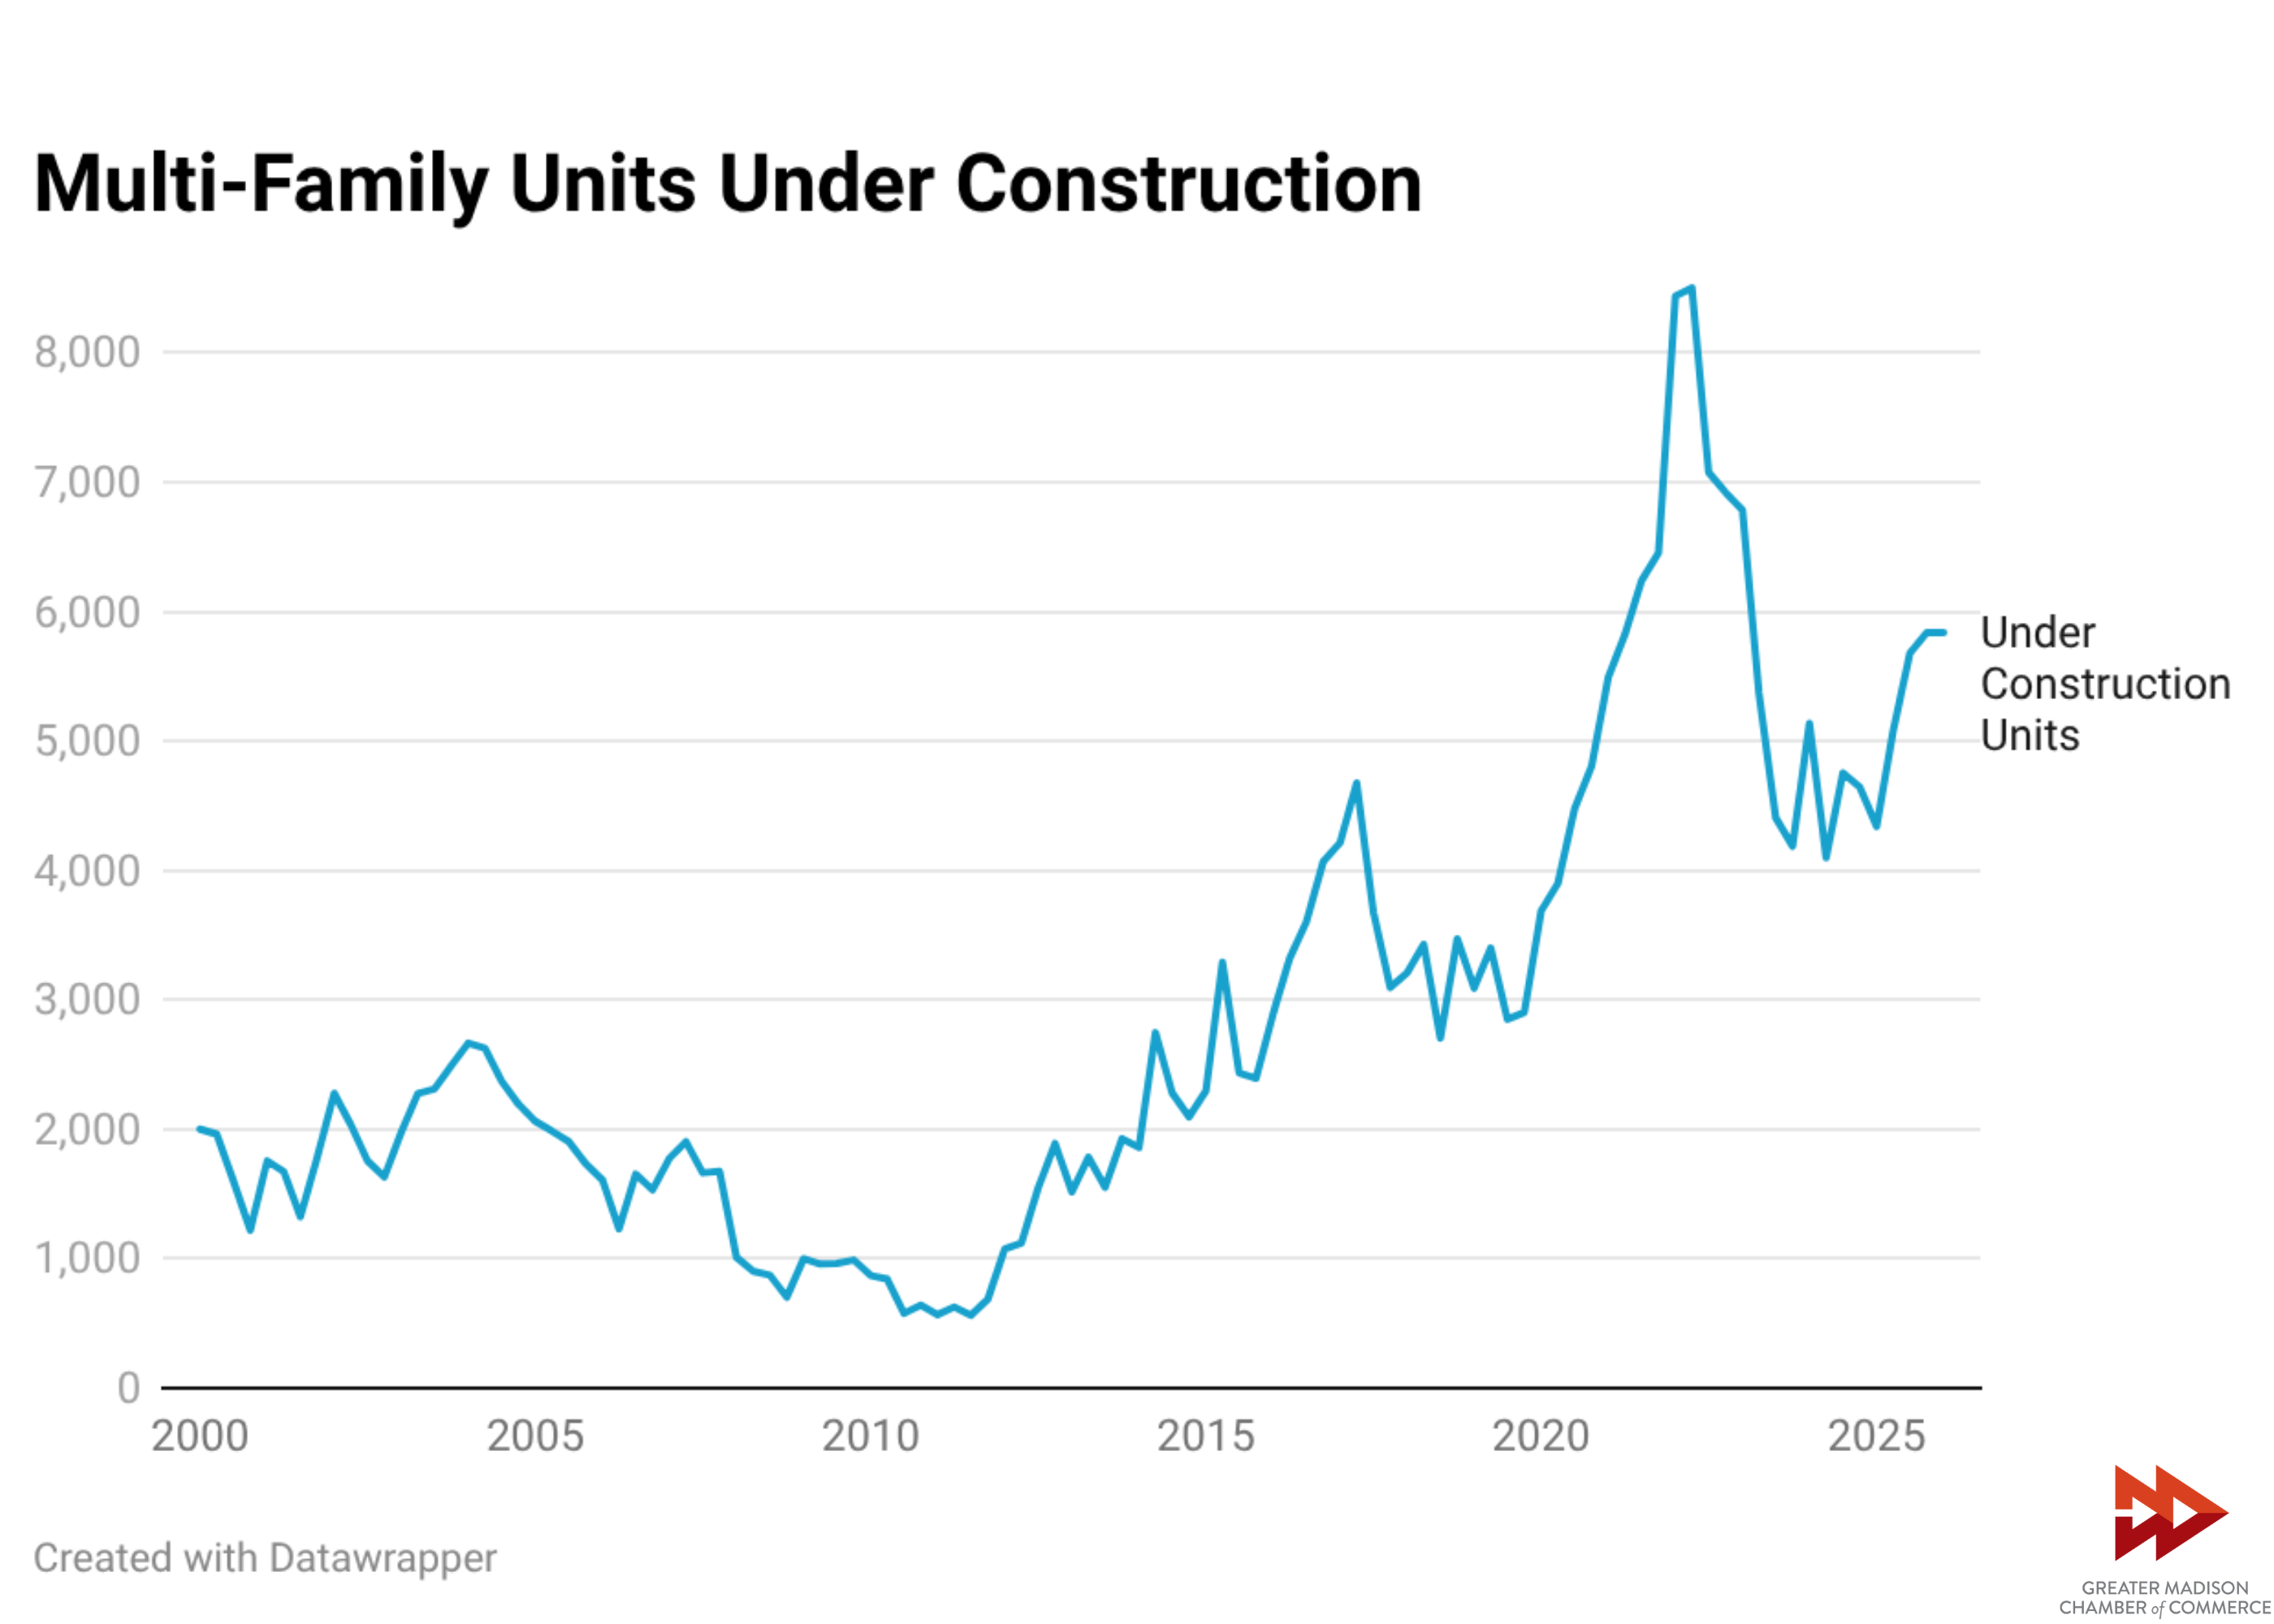
Photo by Richard Hurd
Metro Metrics December 2025
Metro Metrics is a monthly data snapshot that explores key economic indicators reflecting the health of the Madison metro economy.
Q3 Economic Update
This month’s edition of Metro Metrics examines key indicators of Greater Madison’s economy and how they fared during Q3 of 2025.
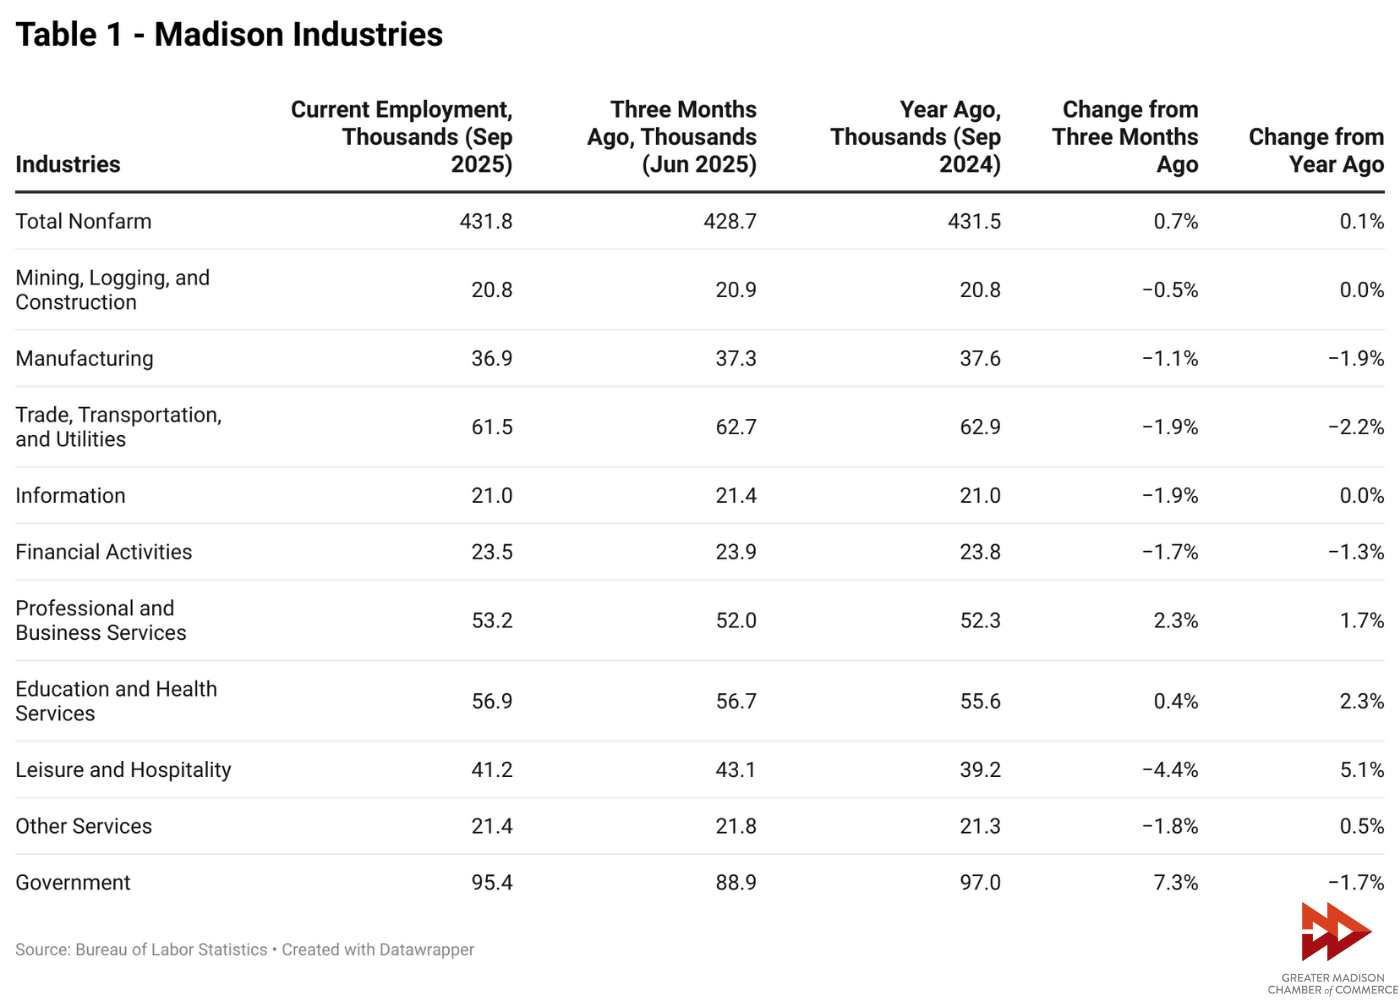
Industries
The Metro’s job numbers began rebounding after decreasing slightly earlier this year (Table 1). Total nonfarm jobs in September exceeded last year’s total jobs for the first time since April. The industries that have grown the most are leisure and hospitality (up 5.1%) and education and health services (up 2.3%). Employment in trade, transportation and utilities decreased by 2.2% since last year.
Labor Force
Greater Madison continues to have a lower unemployment rate than the state of Wisconsin and the nation (Table 2). The Metro’s unemployment rate of 2.3% is fifth lowest out of 387, after only Sioux Falls, SD (1.8%), Rapid City, SD (1.9%), Bismarck, ND (2.0%) and Honolulu, HI (2.2%). The region’s labor force, employed people and unemployed people all decreased since last year. Total labor force decreased by 2.7%, employed people decreased by 2.8% and unemployed people decreased by 6.2%. These figures reinforce findings in the 2025 Next Normal (N²) survey, showing talent attraction and retention as the top barrier to business growth. It also reinforces the importance of talent development and effectively aligning education, training and industry needs to expand the available workforce.
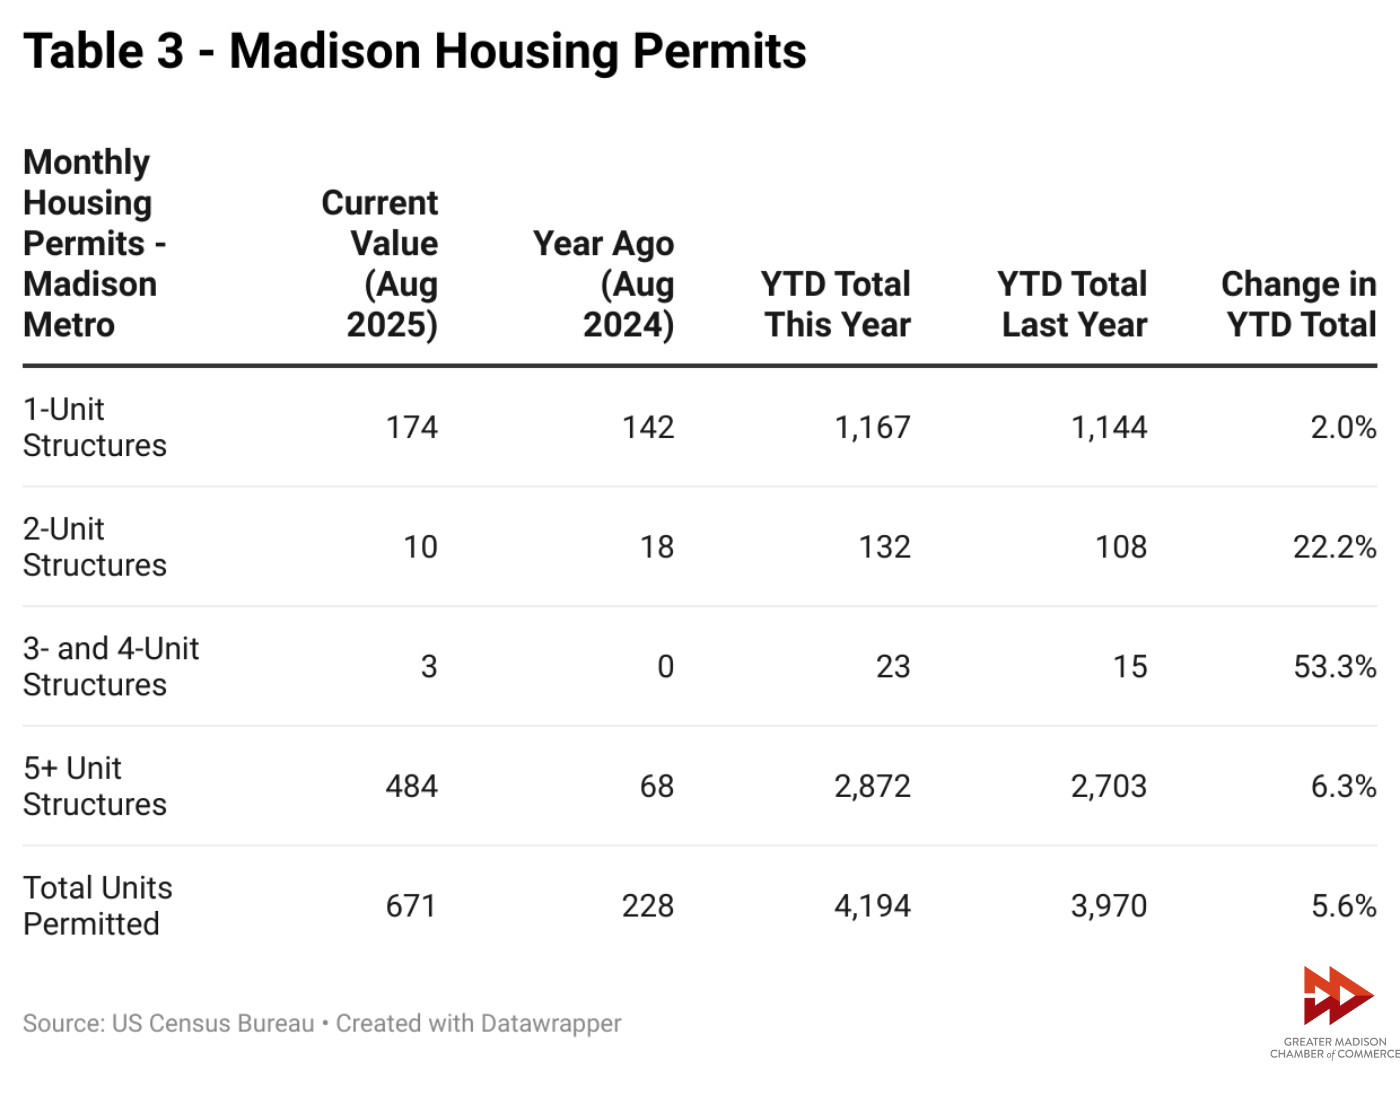
Housing Building Permits
Due to the government shutdown earlier this year, Census Building Permits data for September has not been released, so this section will only cover building permits up to August (Table 3). The Metro has permitted more housing units this year YTD than last year, with nearly 4,200 housing units approved – an increase of about 5.6%.
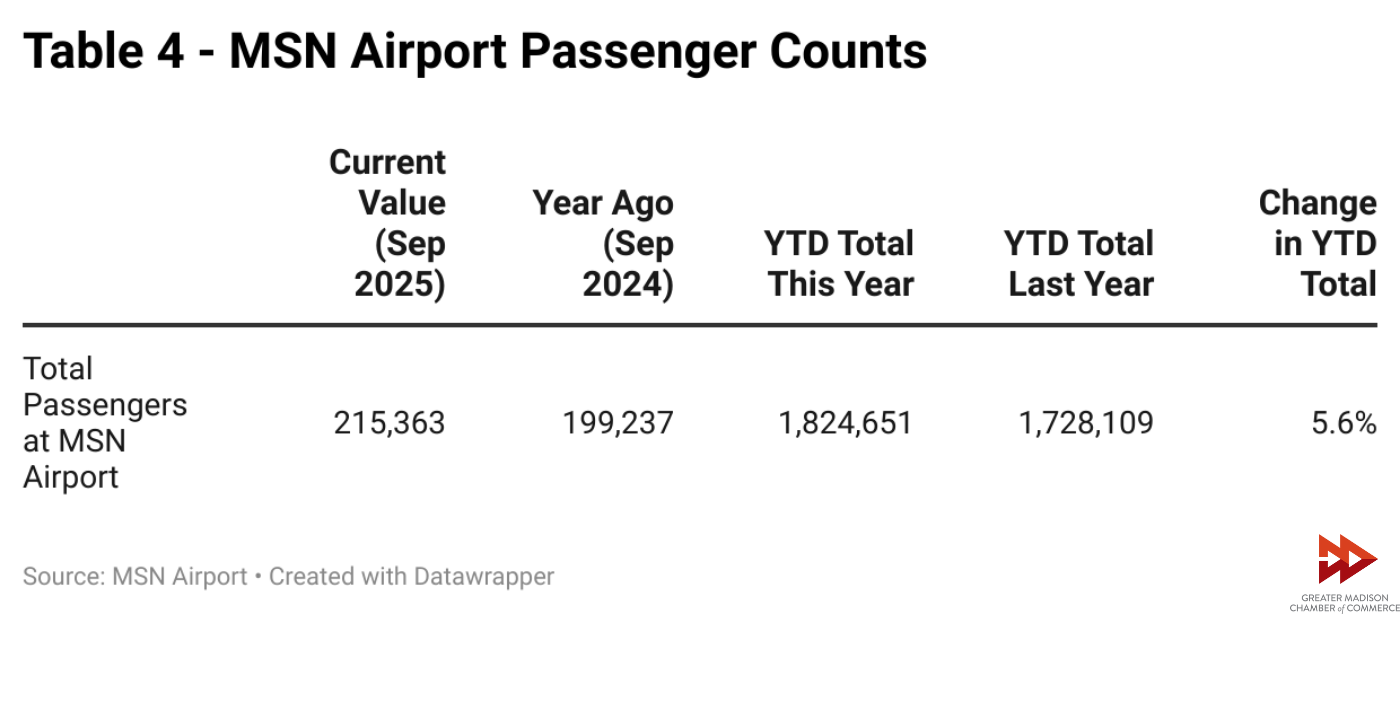
MSN Airport Update
This year’s Dane County Regional Airport passenger counts YTD surpassed pre-pandemic records and are on track to be the airport’s best year yet (Table 4). For more information on how the airport is doing and what its future plans are, the Chamber recently hosted an edition of our Lunch(UP)date program with the airport’s new Executive Director, Mark Papko.
In addition to traffic counts, the airport also recently announced new nonstop service to Boston – one of the most requested business destinations.